This series of notes is about my experience learning and configuring a Kubernetes cluster. Previously, I used a single Virtual Machine to host all my web applications. However, they have become cumbersome to keep track of and are hard to deploy and update. In addition, cloud technologies are in trend and something I want to get practical and theoretical experience on. This article will explain my improvements from the last post, adding a Proxy and implementing Grafana for monitoring.
2023-04-29 20:04:22.147121+00
I have made some improvements and updates in the cluster. Firstly, I upgraded the memory of the master virtual machine from 2 Gib to 4 Gib while keeping the same number of virtual CPUs. The upgrade was necessary because it ran on 80-90% of the memory used at all times and even more when deploying applications or other work. In addition, when I add more features to the cluster, 2 Gib would likely be too little. Secondly, I increased the disk space for both worker nodes. Previously, all nodes had 8 Gib of disk space available. However, since Docker images and Persistent Volumes require a large amount of space, it ended up preventing me from hosting more applications. Therefore, I increased the disk space for all nodes to 16 Gib. The following commands had to be used to utilize the newly added disk:
sudo growpart /dev/nvme0n1 1  # extend a partition
sudo resize2fs /dev/nvme0n1p1 # extends filesystem
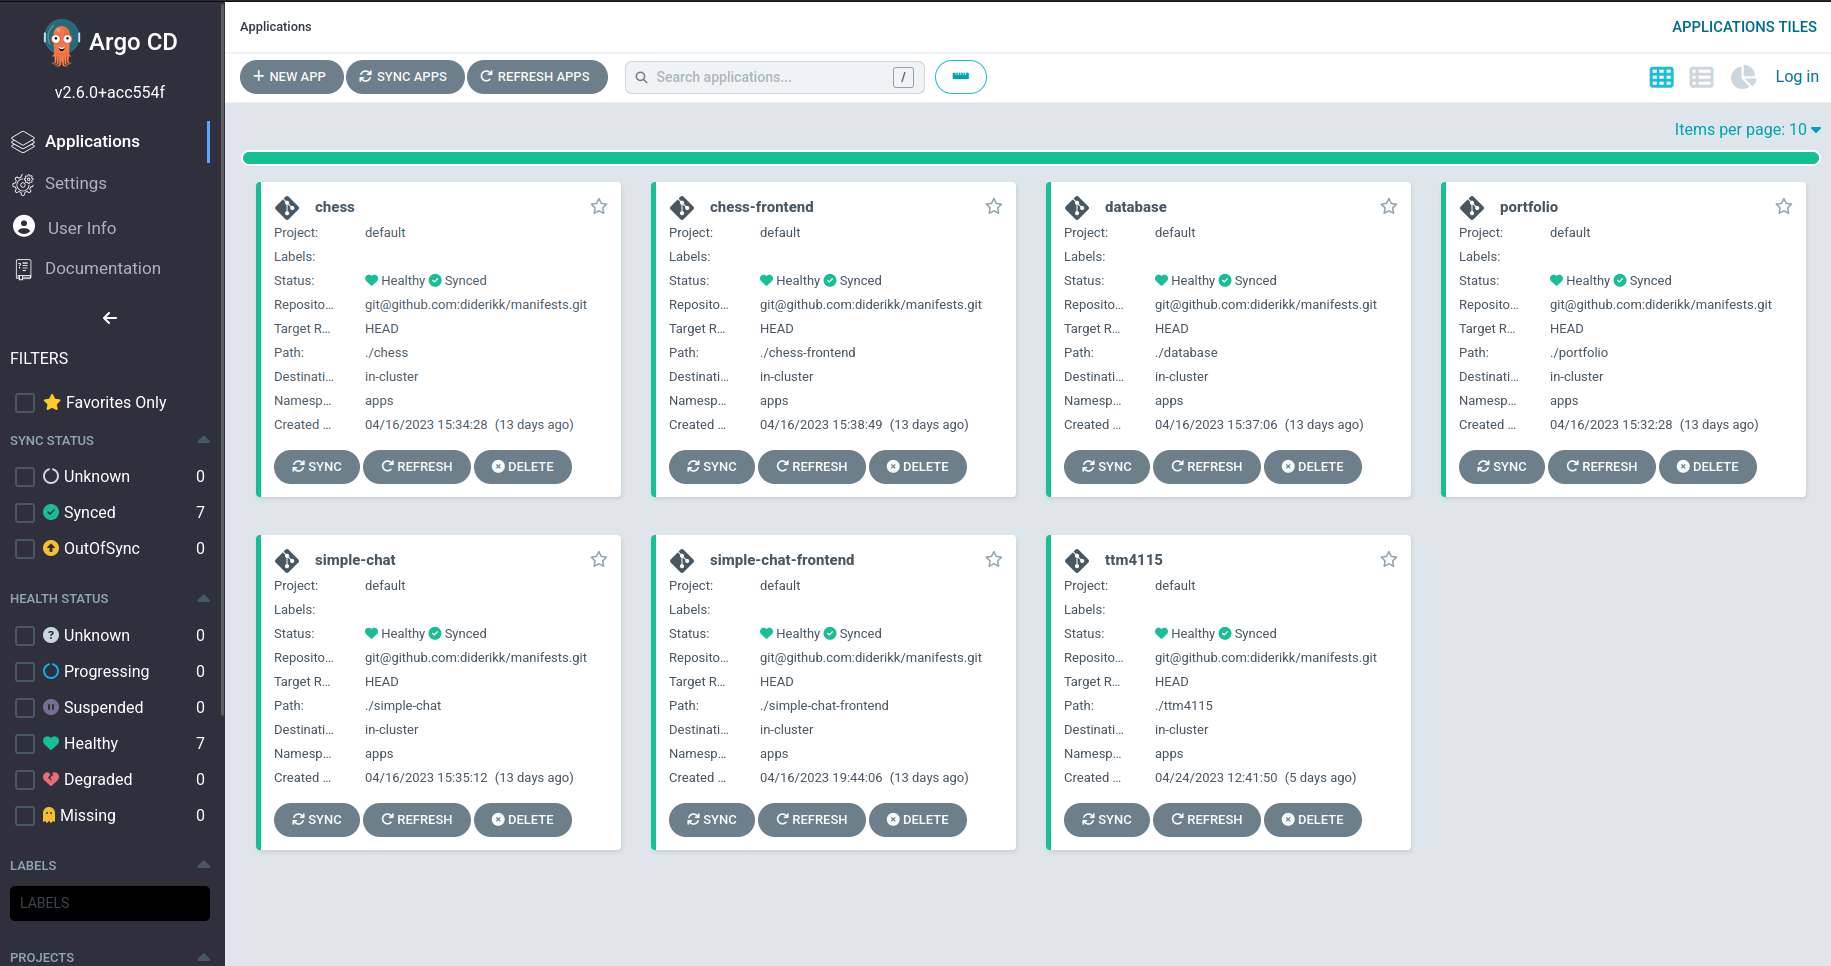
After upgrading the cluster, I moved all my frontend applications to the Kubernetes cluster. The effort of moving the apps was with the intention of using the Proxy and Grafana. In simple terms, the Proxy feature enables me to host applications on the default HTTPS port (port 443), which was not possible previously with just my cluster. Grafana serves as a monitoring platform, giving me more overview of the applications.
As mentioned in a previous note, I am not able to host my Ingress on port 443 or 80. Therefore, I saw it as unfit to host my frontend applications since they would have a URL with a port of 30000. To solve this issue, I looked into setting up a reverse proxy, which, contrary to a proxy, forwards requests from the Internet to servers and not from clients to the Internet.
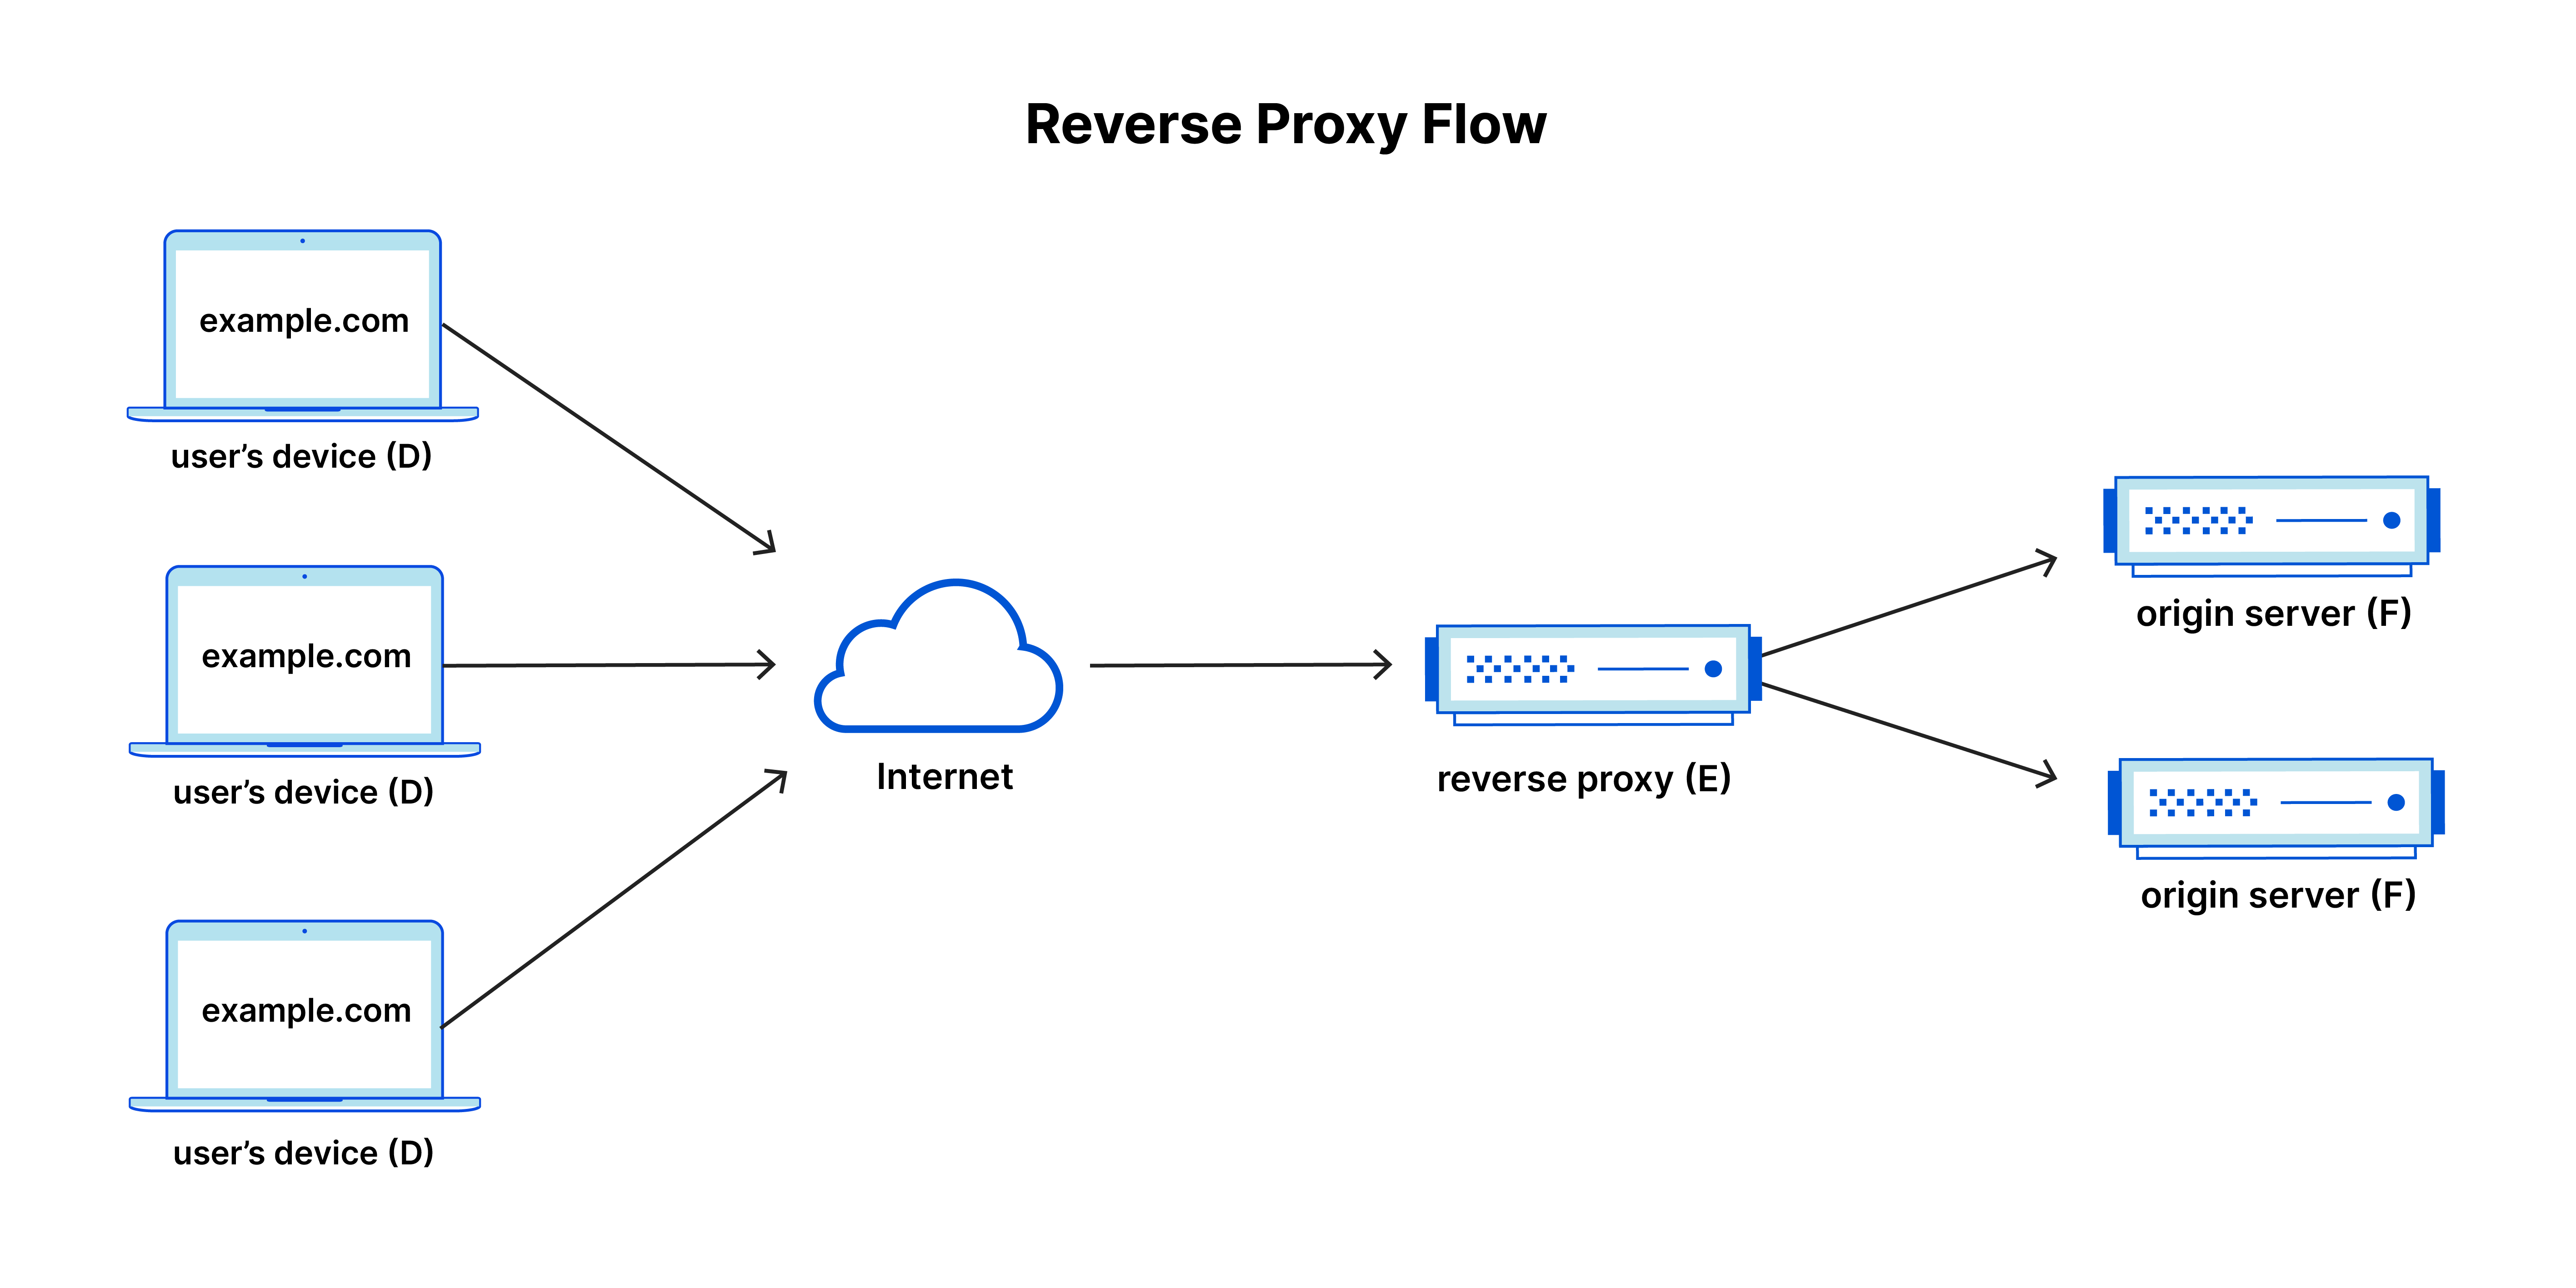
This way, the proxy could listen for requests on port 443/80 and forward them to the cluster, allowing for URLs without ports. In addition, proxies have the functionality to add security measures such as DDoS protection. Without too much research, I decided to use the Nginx Proxy. It had the necessary functionality I was looking for. Later, I also found it had Certbot integration, which made setting up SSL/TLS easy. The following code is the proxy configuration for my Simple Chat frontend application:
server {
    listen 443 ssl; # managed by Certbot
    server_name chat.diderikk.dev www.chat.diderikk.dev;
    ssl_certificate /etc/letsencrypt/live/diderikk.dev/fullchain.pem; # managed by Certbot
    ssl_certificate_key /etc/letsencrypt/live/diderikk.dev/privkey.pem; # managed by Certbot
    include /etc/letsencrypt/options-ssl-nginx.conf; # managed by Certbot
    ssl_dhparam /etc/letsencrypt/ssl-dhparams.pem; # managed by Certbot

    limit_conn perip 20;
    limit_req zone=one burst=25 delay=20;
    proxy_cache cache;
    location = / {
        proxy_pass https://chat.elixirapi.me:30000;
    }

    location / {
        proxy_pass https://chat.elixirapi.me:30000$request_uri;
    }
}
server {
    if ($host = www.chat.diderikk.dev) {
        return 301 https://$host$request_uri;
    } # managed by Certbot

    if ($host = chat.diderikk.dev) {
        return 301 https://$host$request_uri;
    } # managed by Certbot

    listen 80;
    server_name chat.diderikk.dev www.chat.diderikk.dev;
    return 404; # managed by Certbot
}
The first two lines indicate that it listens for requests on port 443 with the host chat.diderikk.dev or www.chat.diderikk.dev. Certbot generates the next lines to add TLS using Let's Encrypt certificate and private key. After that comes the security measurements:
Since I have multiple frontend applications, I split them up by using separate subdomains for each application. As seen in the code above, all requests to the Simple Chat have to use the host chat.diderikk.dev or www.chat.diderikk.dev. Likewise, the cluster has to be mirrored by having separate subdomains for each Service to which the proxy can forward requests:
location / {
   proxy_pass https://chat.elixirapi.me:30000$request_uri;
}
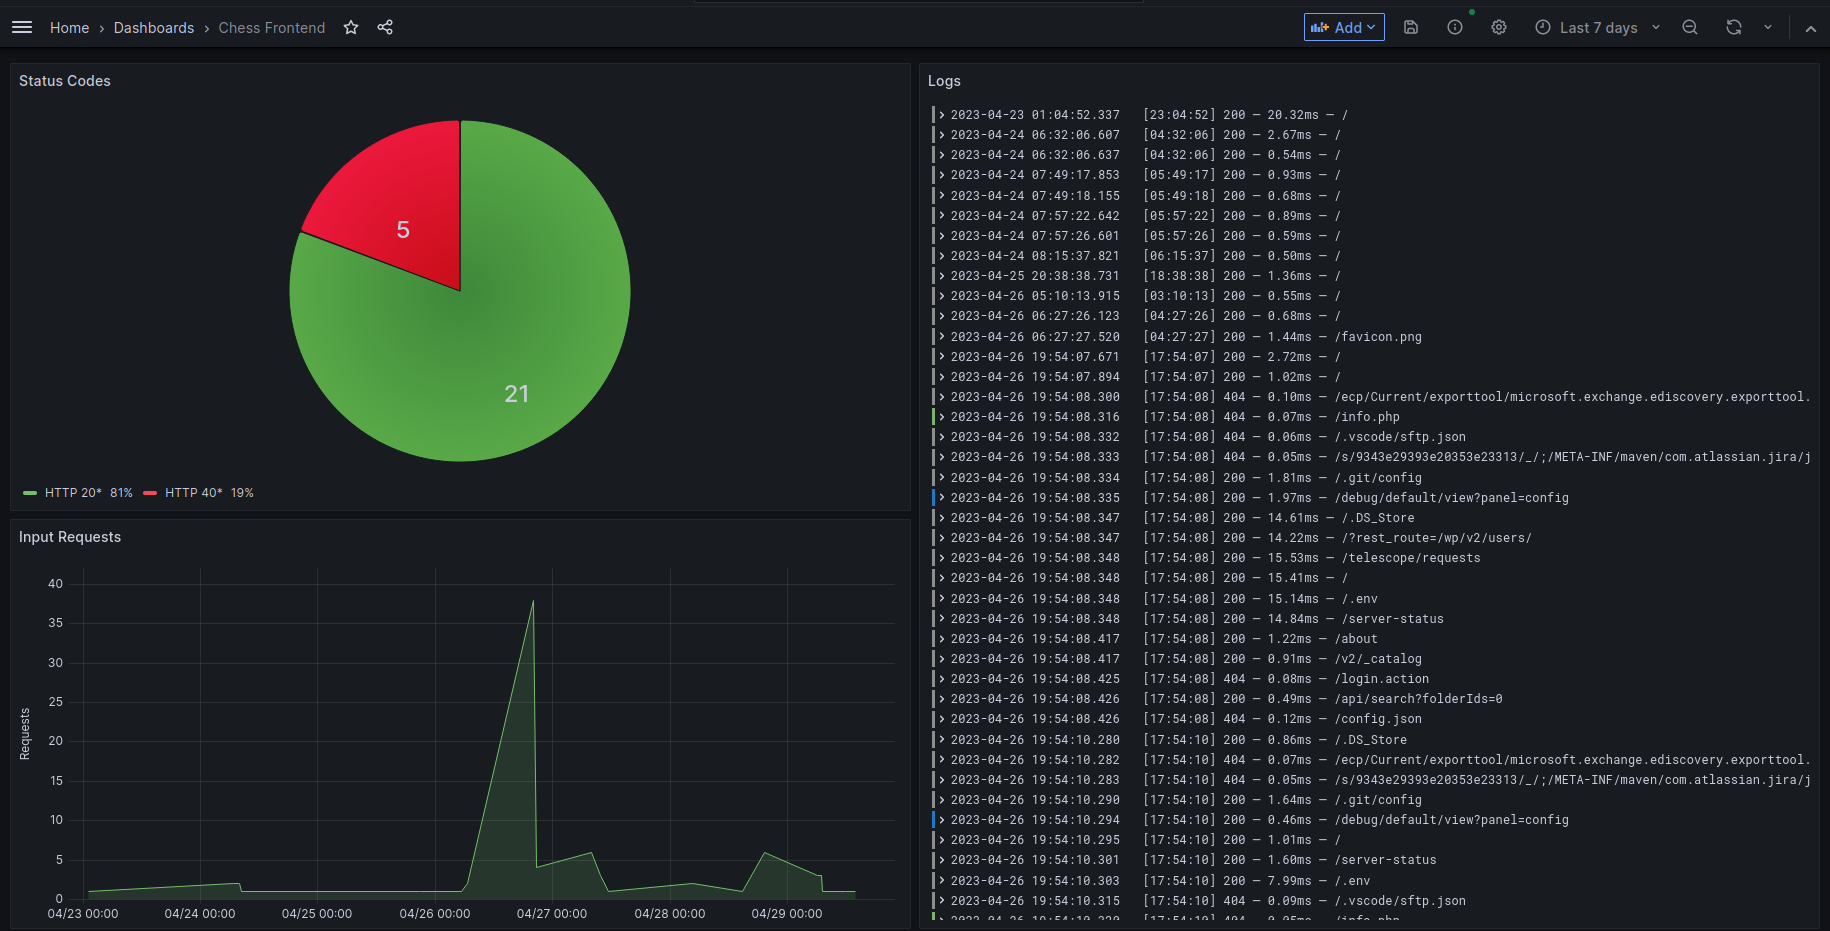
"Grafana allows you to query, visualize, alert on, and understand your metrics no matter where they are stored. Create, explore, and share dashboards with your team and foster a data-driven culture." - Grafana. In addition to being open-source, they have integration with Kubernetes, being simple to set up. I use it to monitor all my applications by querying logs from the running pods. Lately, I also added some visualization, resulting in the given dashboard: